Know which of your sites and suppliers are exposed — and what breaks if one goes down.
Conflict, sanctions, unrest and natural hazards, checked every day against your plants, offices, data centres, suppliers and shipping lanes. Every score shows the events behind it, what it puts at risk in revenue, and what is being done about it — and prints as the board pack your directors read.
The output is the document your board already asks for.
Not a dashboard to interpret — a one-click risk & resilience board pack: exposure trend, the 5×5 matrix, top exposures inherent → residual, single points of failure priced in revenue per day, the treatment programme with owners and dates, and an honest mapping to ISO 22301, ISO 31000, NIS2 and SEC Item 106. Print to PDF exactly as rendered.
Underneath it, a register where every likelihood unrolls to the events that drove it, by id and source. Nothing on the page is an unexplained score.
Open the demo board pack →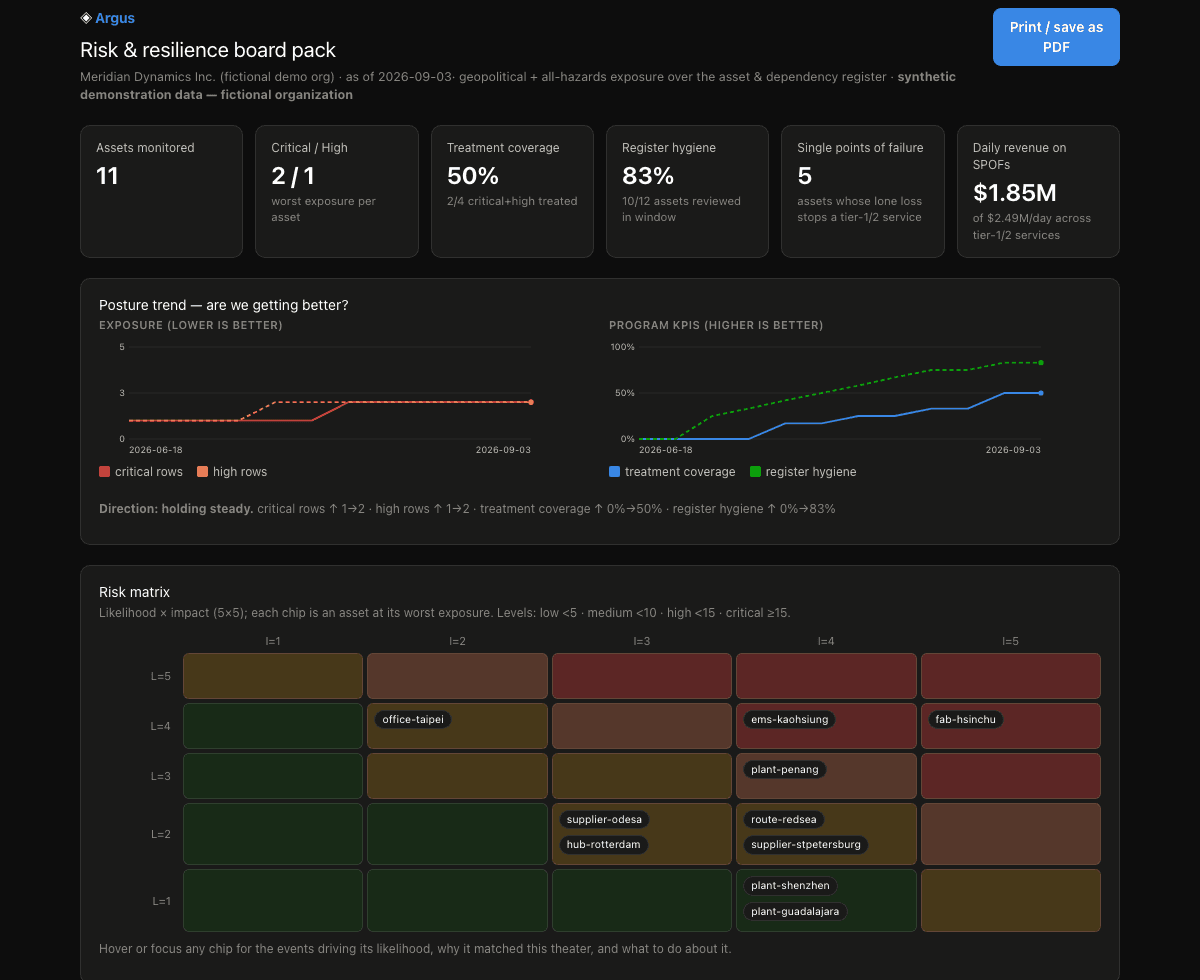 Synthetic demo data · fictional organization (Meridian Dynamics)
Built for the people who have to answer “are we exposed?”
Operations & continuity leads — no risk team required
Load your sites and suppliers and see, on one page, which are exposed, what would stop if one failed, and what that costs per day. Plain words first; the evidence one click behind.
Supply chain & procurement
Upload your supplier list. See which suppliers and lanes sit near conflict, sanctions, port disruption or storms — and which single supplier would stop a product line, and which has a backup that keeps it running.
Banks & financial institutions
Critical vendors, data centres and operations sites as a likelihood × impact register with inherent and residual risk, owners and review dates — evidence for your operational-resilience and third-party-risk work.
Critical infrastructure & government contractors
Facilities and the suppliers behind them, checked against conflict, sanctions, export controls and natural hazards, with crisis exercises run against your real register.
Risk & resilience advisors
Ground client recommendations in evidence the client can check: a register they keep after the engagement, tabletop exercises, and briefs where every line cites its source.
Security, threat intelligence & IT
Sites on a live map with alerts when a risk changes level; STIX 2.1 and JSON feeds, scoped API keys, an API to push your own events, and single sign-on through your identity provider.
Help from analysts, not just software.
No risk team? We will build your register with you, map what breaks if a supplier fails, run a crisis exercise with your leadership, or keep watch month to month — fixed price, agreed before we start, delivered by the analysts who build Argus. The work stays in your organisation when we are done.
See advisory services →How it works
- Load your assets. A spreadsheet or the API — plants, offices, suppliers, routes — with a location, how much each one matters to you (1–5), and optionally the products or services they support.
- The feed does the watching. Official, academic and news sources are collected every day, graded by how well each event is evidenced, and placed on the map — every one with a link to where it came from.
- The register does the arithmetic. How each region’s activity compares with its usual level × how much each site matters to you, risk passed on from the suppliers a site depends on, hazards by distance, and the risk left after your safeguards — the same fixed rules every time, tested so the numbers never drift.
- You decide, and it remembers. Record what you will do about each serious risk (accept, reduce, insure or avoid it), who owns it and when it is reviewed, watch the share covered climb, and export the board pack.
Coverage today: Conflict, sanctions and unrest are monitored in 12 regions: Taiwan Strait, South China Sea, East China Sea, Korean Peninsula, Russia–Ukraine, Baltic & Nordic, Middle East, Red Sea & Horn of Africa, Sahel & West Africa, Latin America, Southeast Asia and South Asia. Arctic is also monitored when you tick it for an asset. Sites elsewhere, including North America and most of Europe, are checked only for natural hazards nearby.
Auditable beats authoritative.
We publish what most vendors keep behind a demo: the scoring constants, the source register with its licences and lags, the security architecture, and the limitations of the instrument. Reviewers are invited to read all of it before the first call.
Methodology
Every weight and threshold rendered from the code that runs it, plus a limitations section we wrote ourselves.
Sources & licensing
Every source: publisher, coverage, cadence, typical lag, licence, and what attribution you owe when you republish.
Security
Tenant isolation in the database, hashed keys, derived webhook secrets, three named subprocessors.
Glossary
Every term on every screen — likelihood, DIME, SPOF, cut set, residual, RTO/MTPD — with why it matters.
Track record
How the scores will be checked against outcomes, the corrections already published, and every methodology version shipped.
Published pricing. Every tier.
Analyst $99/mo
Feed (JSON + STIX), the exposure register, a read-scoped API key. For one analyst or researcher.
Team $499/mo
Alerting, dependency graph and SPOFs, wargame, board pack, ingest API. For a team running a live register.
Enterprise $2,500/mo
Enterprise SSO, scale, card or invoice, priority support. For an organization that needs a paper trail.
Tour the demo
A fully seeded fictional organization — no account, no configuration. Add your own sites in the sandbox and the register recomputes in your browser; your list never leaves it.
Open live demo →Sign in
Access your organization's console with your corporate identity.
Sign inAlready signed in? Go to your console →Pricing · Services · Methodology · Sources · Glossary · Track record · Advisories · Security · bhyde@engsecsolutions.com